
Thursday, October 15, 2026

Lumentum Undershipping AI Photonics Demand by 30% Through 2027, $400M+ Backlog Signals Multi-Year Supply Crunch

Lumentum is delivering 30% below customer demand for photonics components critical to AI infrastructure, with all EML capacity locked in agreements through end-2027. The company's OCS backlog has surged past $400M, most shipping in H2, while capacity additions only widen the demand-supply gap.

Lumentum Undershipping AI Photonics Demand by 30% Through 2027, $400M+ Backlog Signals Multi-Year Supply Crunch
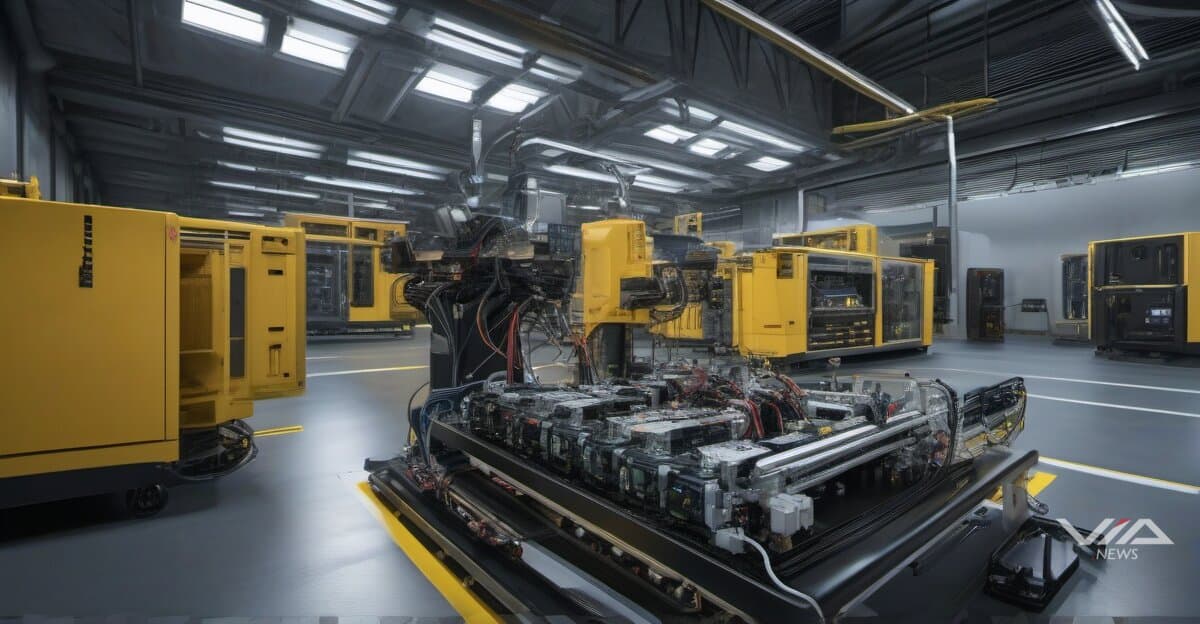
Image generated by AI for illustrative purposes. Not actual footage or photography from the reported events.

Lumentum is shipping 30% below customer orders for photonics components that power AI network infrastructure, signaling a sustained supply crunch that extends through calendar 2027. All externally modulated laser (EML) production capacity is committed under long-term agreements running through at least end-2027, leaving hyperscalers competing for limited allocation.

The company's optical communications (OCS) backlog has climbed past $400 million, with most units scheduled for second-half delivery. Management added indium phosphide manufacturing capacity by over 20% in the December quarter alone, with further expansions planned. Despite these additions, the demand-supply imbalance is widening rather than closing.

Lumentum now positions itself as a foundational supplier to virtually every major AI network deployment. The component shortage creates multi-year revenue visibility for specialized photonics manufacturers, contrasting sharply with typical tech hardware cycles that see rapid supply-demand rebalancing.

For investors, this presents a rare scenario where capacity constraints drive sustained pricing power and order visibility. Companies holding long-term supply agreements gain competitive advantages in AI infrastructure buildouts, while those without allocations face deployment delays or higher spot-market pricing.

The bottleneck sits at indium phosphide wafer fabrication, a capital-intensive process requiring 18-24 month lead times for meaningful capacity additions. This creates a structural moat for incumbent suppliers with existing fab infrastructure. Coherent, II-VI, and other photonics players face similar demand dynamics.

Supply chain risk materializes in two forms: hyperscalers may need to adjust datacenter deployment schedules based on component availability, and equipment manufacturers lacking photonics allocations could lose market share to better-supplied competitors. The 30% undershipping rate suggests current AI infrastructure plans exceed realistic near-term delivery capabilities.

Long-term agreements through 2027 lock in customer commitments but also limit supplier flexibility to serve new entrants or faster-growing accounts. This favors established AI players with early supply contracts over later-stage entrants attempting to scale infrastructure rapidly.

What we know · the intelligence behind this page
Live from the substrate
What we're seeing
Q4 2026 Clinical Catalyst Season: Big-Pharma Data Flow, Regulatory Milestones, and a Thin AI-Drug Fringe
October 2026 conferences (EASD, IGCS, NACFC, HFSA) are producing a dense run of late-stage readouts from Novo Nordisk, Lilly, Roche, Bayer, Vertex and Galderma. Regulatory milestones are scheduled behind them: the ivonescimab BLA PDUFA date on 2026-11-14, FDA acceptance of Roche's vamikibart BLA, and Scholar Rock's EMA resubmission. The AI-and-finance angle is peripheral. It consists of the AI-designed drug Rentosertib and QAIAx, a speculative microcap whose trial claims (the QIII pilot, anticipated 2027-01-01, and a patent update) are forecasts and filings rather than data, so they warrant skepticism.
Our read on the data ›
Signals we're tracking
EPKINLY Regulatory-Clinical Success Cascade
High probability of expanded label indications, additional combination approvals, and competitive positioning strength in follicular lymphoma market. Predicts positive commercial uptake and potential accelerated review for related indications.
Patterns we're watching ›
Where sources disagree
ING Group
Both facts record the same metric (shares_outstanding) for ING Group at the identical observation date (2025-12-31). FACT A states 2,902,437,688 shares; FACT B states 2,902 million shares (2,902,000,000). The difference is 437,688 shares (~0.015%). This is a genuine value conflict, though the discrepancy appears to result from FACT B rounding to the nearest million while FACT A provides the precise count.
We flag conflicts openly ›
Recently verified
✓ Checked against the original source
4,986
facts traced to their source — and we flag the ones that don't hold up.
101 entities tracked4,986 facts checked against source5,375 source documents archived
Query this data → isubstrate.com