
Wednesday, October 14, 2026

Central Banks Split on 2026 Rates as ECB Eyes Hikes, Indonesia Signals More Cuts

Major central banks are taking divergent paths in early 2026, with the ECB's Isabel Schnabel floating potential rate hikes while Bank Indonesia's Perry Warjiyo signals room for further cuts. The policy splits are driving currency volatility as investors reposition portfolios across regions with widening rate differentials.

Central Banks Split on 2026 Rates as ECB Eyes Hikes, Indonesia Signals More Cuts
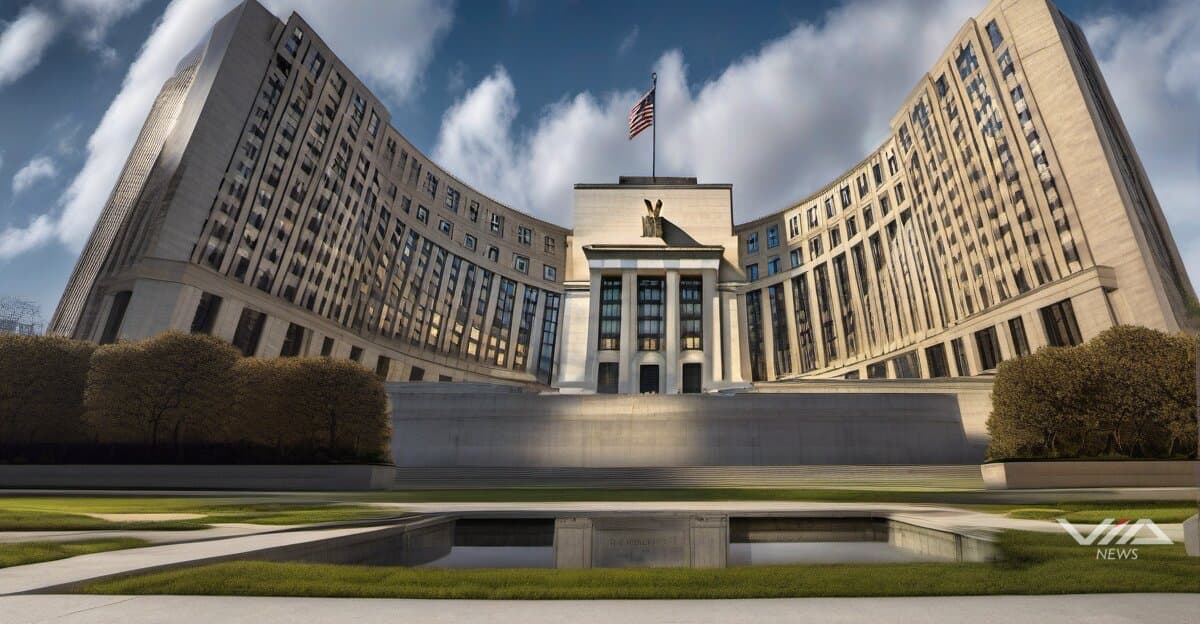
Image generated by AI for illustrative purposes. Not actual footage or photography from the reported events.

The European Central Bank may raise rates next, according to board member Isabel Schnabel, diverging from easing trends elsewhere. The ECB projected 1% growth for 2026 in its September forecast round.

Bank Indonesia Governor Perry Warjiyo is expected to signal continued cuts through 2026. Mexico's Victoria Rodriguez Ceja sees a quarter-point cut to 7% next month as highly likely.

Norway's Norges Bank plans cuts at a glacial pace—one quarter-point annually through 2028. The Bank of Canada is holding rates steady unless the economic outlook shifts, with core metrics pointing to 2.5% underlying inflation.

Fed Chair Jerome Powell said December's rate cut wasn't guaranteed after October's reduction, leaving U.S. policy uncertain.

Currency markets face pressure from these policy splits. Wider rate differentials between the eurozone and emerging markets typically drive capital flows toward higher-yielding currencies, while safe-haven flows support currencies where rates hold or rise.

Banks are adjusting cross-border lending strategies as funding costs diverge. European banks may face higher funding expenses if ECB rates rise, while Indonesian and Mexican banks could see cheaper liquidity supporting loan growth.

Bond markets show this tension. Yield spreads between developed and emerging markets are widening as investors price in different rate trajectories. Portfolio managers are tracking 90-day volatility indices for EUR, CAD, and NOK against the dollar.

The policy divergence creates opportunities and risks. Carry trades—borrowing in low-rate currencies to invest in high-rate markets—become attractive but vulnerable to sudden reversals. The 2013 taper tantrum showed how quickly capital can flee emerging markets when developed-market policy shifts.

Financial institutions are monitoring net capital flows between regions. Banks with international operations must balance asset-liability mismatches as rate environments fragment.

This cycle differs from 2015-2019, when most central banks moved in loose coordination. Now, domestic inflation pressures and growth outlooks vary enough that synchronized policy appears unlikely through 2026.

What we know · the intelligence behind this page
Live from the substrate
What we're seeing
Q4 2026 Clinical Catalyst Season: Big-Pharma Data Flow, Regulatory Milestones, and a Thin AI-Drug Fringe
October 2026 conferences (EASD, IGCS, NACFC, HFSA) are producing a dense run of late-stage readouts from Novo Nordisk, Lilly, Roche, Bayer, Vertex and Galderma. Regulatory milestones are scheduled behind them: the ivonescimab BLA PDUFA date on 2026-11-14, FDA acceptance of Roche's vamikibart BLA, and Scholar Rock's EMA resubmission. The AI-and-finance angle is peripheral. It consists of the AI-designed drug Rentosertib and QAIAx, a speculative microcap whose trial claims (the QIII pilot, anticipated 2027-01-01, and a patent update) are forecasts and filings rather than data, so they warrant skepticism.
Our read on the data ›
Signals we're tracking
EPKINLY Regulatory-Clinical Success Cascade
High probability of expanded label indications, additional combination approvals, and competitive positioning strength in follicular lymphoma market. Predicts positive commercial uptake and potential accelerated review for related indications.
Patterns we're watching ›
Where sources disagree
ING Group
Both facts record the same metric (shares_outstanding) for ING Group at the identical observation date (2025-12-31). FACT A states 2,902,437,688 shares; FACT B states 2,902 million shares (2,902,000,000). The difference is 437,688 shares (~0.015%). This is a genuine value conflict, though the discrepancy appears to result from FACT B rounding to the nearest million while FACT A provides the precise count.
We flag conflicts openly ›
Recently verified
✓ Checked against the original source
4,986
facts traced to their source — and we flag the ones that don't hold up.
101 entities tracked4,986 facts checked against source5,375 source documents archived
Query this data → isubstrate.com