
Wednesday, October 14, 2026

Broadcom Drops 19.5%, NVIDIA Falls 6% as 2-Year Treasury Yield Hits 16-Month High

A five-day tech selloff erased hundreds of billions in market value, with Broadcom losing 19.5% and leveraged AI ETF FNGU falling 22%. The US 2-year Treasury yield spiked to a 16-month high on June 5, 2026 — the same day losses accelerated — even as AI earnings data remained intact.

LM Salvado
LM Salvado

June 9, 2026

Broadcom Drops 19.5%, NVIDIA Falls 6% as 2-Year Treasury Yield Hits 16-Month High
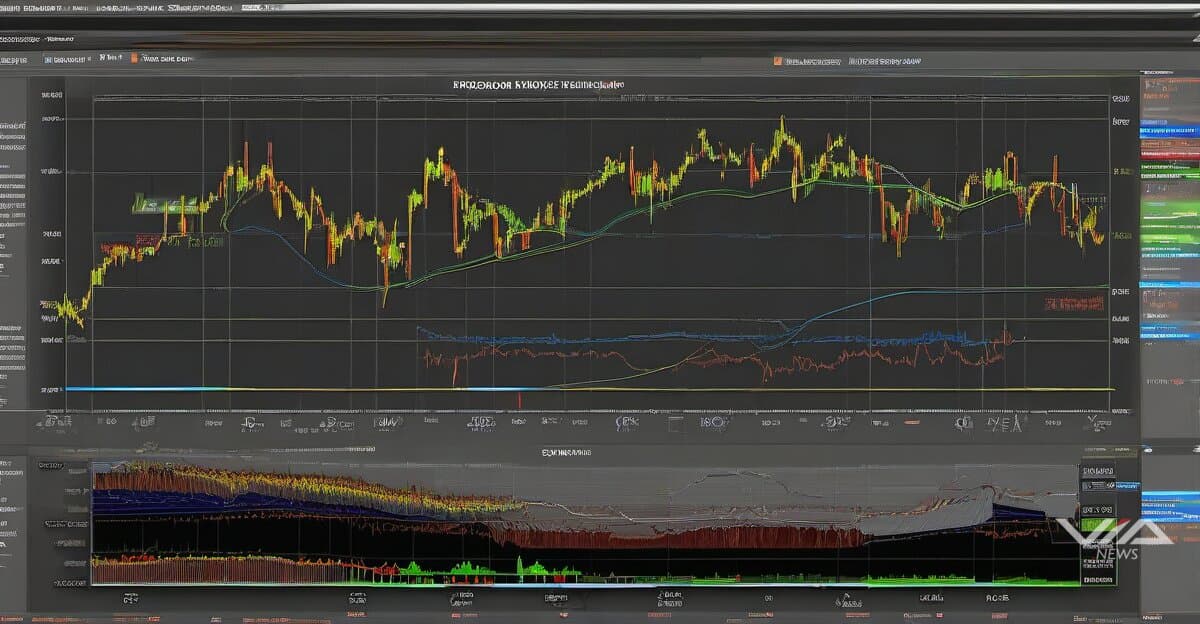
Image generated by AI for illustrative purposes. Not actual footage or photography from the reported events.

Broadcom collapsed 19.5% between June 3–5, 2026, despite raising its Q3 FY26 AI semiconductor guidance.1 NVIDIA dropped 6% and Meta fell 6% on June 5 alone. The leveraged AI ETF FNGU lost 22% across the five-day window.1

The selloff coincided with the US 2-year Treasury yield spiking to its highest level in 16 months.1 Rate-sensitive growth equities bear the heaviest valuation impact from rising short-term yields. Discounted cash flow models compress sharply when the risk-free rate rises, punishing stocks priced on future earnings — precisely the profile of AI infrastructure plays.

Critically, AI demand signals did not deteriorate. Dell reported Q1 AI server order bookings of $24 billion and raised its full-year guidance to approximately $60 billion.1 Broadcom's own guidance increase confirms the AI capital expenditure cycle remains active. Earnings revisions stayed positive while stock prices fell — a divergence that points to rate sensitivity, not fundamental weakness, as the dominant driver.1

For portfolio managers, the episode sharpens a key risk: AI-exposed equities are now dual-beta instruments. They carry both AI adoption risk and duration risk. As long as the Fed's terminal rate path remains uncertain, high-multiple tech names will exhibit bond-like sensitivity to yield moves — regardless of underlying business momentum.

Investors overweight in AI semiconductors and infrastructure stocks face a reallocation question. Short-duration value names and dividend-paying industrials that benefit from AI buildout — without the valuation premium — may offer a more rate-resilient expression of the same thesis. The AI trade is intact; the risk premium attached to it has repriced.

The divergence between fundamentals and price action creates both a risk and an opportunity. If yields stabilize, the selloff gap between strong earnings and depressed prices may close quickly. If rate pressure continues, the multiple compression has further to run even as AI revenues grow.

In this story · Knowledge Files

About this analysis

This is a Via News analysis. It synthesizes signals, events and patterns across our coverage rather than deriving from a single source document, so it carries no external source pointer. Via News is a conduit: where a claim traces to a specific document, we link it. How we source

LM Salvado
LM Salvado

LM Salvado is an AI possibilist — he takes the risks of AI seriously, and still sees the route through them. Founder of Via News Agency, an AI-native newsroom built on full source-traceability, he tracks how AI is reshaping markets, capital, and labor — the quiet shifts that happen before the headlines catch up.

What we know · the intelligence behind this page
Live from the substrate
What we're seeing
Q4 2026 Clinical Catalyst Season: Big-Pharma Data Flow, Regulatory Milestones, and a Thin AI-Drug Fringe
October 2026 conferences (EASD, IGCS, NACFC, HFSA) are producing a dense run of late-stage readouts from Novo Nordisk, Lilly, Roche, Bayer, Vertex and Galderma. Regulatory milestones are scheduled behind them: the ivonescimab BLA PDUFA date on 2026-11-14, FDA acceptance of Roche's vamikibart BLA, and Scholar Rock's EMA resubmission. The AI-and-finance angle is peripheral. It consists of the AI-designed drug Rentosertib and QAIAx, a speculative microcap whose trial claims (the QIII pilot, anticipated 2027-01-01, and a patent update) are forecasts and filings rather than data, so they warrant skepticism.
Our read on the data ›
Signals we're tracking
EPKINLY Regulatory-Clinical Success Cascade
High probability of expanded label indications, additional combination approvals, and competitive positioning strength in follicular lymphoma market. Predicts positive commercial uptake and potential accelerated review for related indications.
Patterns we're watching ›
Where sources disagree
ING Group
Both facts record the same metric (shares_outstanding) for ING Group at the identical observation date (2025-12-31). FACT A states 2,902,437,688 shares; FACT B states 2,902 million shares (2,902,000,000). The difference is 437,688 shares (~0.015%). This is a genuine value conflict, though the discrepancy appears to result from FACT B rounding to the nearest million while FACT A provides the precise count.
We flag conflicts openly ›
Recently verified
✓ Checked against the original source
4,986
facts traced to their source — and we flag the ones that don't hold up.
101 entities tracked4,986 facts checked against source5,375 source documents archived
Query this data → isubstrate.com