
Thursday, October 15, 2026

Interactive Brokers achieves 1.3 basis point all-in trading cost, setting new fintech benchmark

Interactive Brokers PRO clients paid just 1.3 basis points in total trading costs for U.S. stocks in February 2026, down from 1.9 basis points in January. The broker's four-decade technology investment now delivers execution and clearing costs below competitors' commission-only rates, forcing traditional brokers to choose between automation or market exit.

Interactive Brokers achieves 1.3 basis point all-in trading cost, setting new fintech benchmark
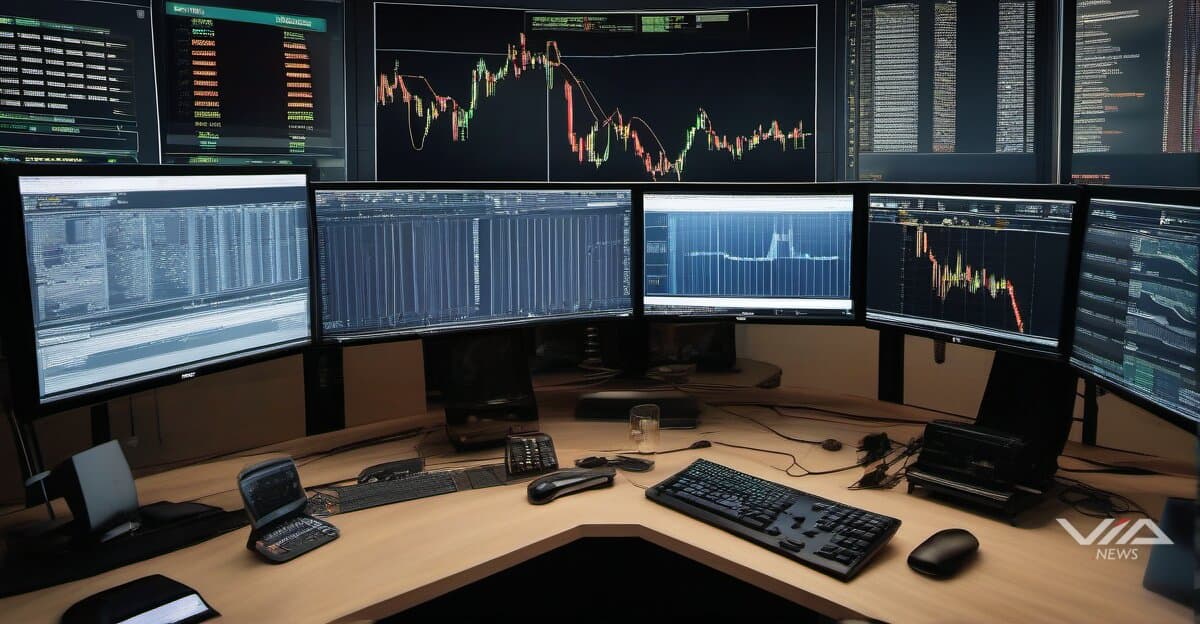
Image generated by AI for illustrative purposes. Not actual footage or photography from the reported events.

Interactive Brokers reported 1.3 basis point all-in trading costs for PRO clients executing U.S. Reg.-NMS stocks in February 2026, with average trade size of $24,009. This represents a 32% decrease from January's 1.9 basis points on $21,785 average trades.

The 1.3 basis point figure includes execution costs, clearing fees, exchange charges, and regulatory assessments. On a $24,009 trade, total costs equal $3.12. Traditional brokers typically charge $5-10 in commissions alone before adding the same regulatory and exchange fees Interactive Brokers already includes.

Rolling twelve-month averages show sustained low-cost performance: 2.6 basis points in January and 2.7 basis points in February. Interactive Brokers attributed the cost structure to "four decades of focus on technology and automation" enabling a sophisticated client platform.

Exchange, clearing and regulatory fees consume 58-60% of futures commissions industry-wide, leaving minimal room for broker margin compression without matching Interactive Brokers' automation levels. Competitors charging $5-10 per equity trade face a structural disadvantage: their commission alone exceeds Interactive Brokers' all-in cost by 300-700%.

The cost gap creates two strategic paths for traditional brokers. First, invest heavily in AI and machine learning systems to automate trade execution, custody, and client servicing infrastructure. Second, exit retail equity trading entirely and focus on higher-margin products like options, managed accounts, or advisory services.

Market share data over the next 12-24 months will reveal which brokers can bridge the automation gap. Firms announcing technology investments without subsequent cost reductions will likely lose clients to automated platforms. Those maintaining high-cost structures risk commoditization of their core business.

Interactive Brokers' sub-3 basis point threshold establishes a competitive benchmark that makes traditional brokerage models economically unviable. Brokers lacking comparable technology infrastructure face pressure to transform operations or concede market segments to automated competitors.

What we know · the intelligence behind this page
Live from the substrate
What we're seeing
Q4 2026 Clinical Catalyst Season: Big-Pharma Data Flow, Regulatory Milestones, and a Thin AI-Drug Fringe
October 2026 conferences (EASD, IGCS, NACFC, HFSA) are producing a dense run of late-stage readouts from Novo Nordisk, Lilly, Roche, Bayer, Vertex and Galderma. Regulatory milestones are scheduled behind them: the ivonescimab BLA PDUFA date on 2026-11-14, FDA acceptance of Roche's vamikibart BLA, and Scholar Rock's EMA resubmission. The AI-and-finance angle is peripheral. It consists of the AI-designed drug Rentosertib and QAIAx, a speculative microcap whose trial claims (the QIII pilot, anticipated 2027-01-01, and a patent update) are forecasts and filings rather than data, so they warrant skepticism.
Our read on the data ›
Signals we're tracking
EPKINLY Regulatory-Clinical Success Cascade
High probability of expanded label indications, additional combination approvals, and competitive positioning strength in follicular lymphoma market. Predicts positive commercial uptake and potential accelerated review for related indications.
Patterns we're watching ›
Where sources disagree
ING Group
Both facts record the same metric (shares_outstanding) for ING Group at the identical observation date (2025-12-31). FACT A states 2,902,437,688 shares; FACT B states 2,902 million shares (2,902,000,000). The difference is 437,688 shares (~0.015%). This is a genuine value conflict, though the discrepancy appears to result from FACT B rounding to the nearest million while FACT A provides the precise count.
We flag conflicts openly ›
Recently verified
✓ Checked against the original source
4,986
facts traced to their source — and we flag the ones that don't hold up.
101 entities tracked4,986 facts checked against source5,375 source documents archived
Query this data → isubstrate.com