
Thursday, October 15, 2026

Renault-Nissan-Mitsubishi Alliance Faces Medium-Probability Breakup Risk from Strategic Misalignment

The Renault-Nissan-Mitsubishi Alliance confronts a catastrophic operational risk as diverging strategic interests threaten the 25-year partnership. Analysts assign medium likelihood to fragmentation scenarios that could reshape $180 billion in combined market capitalization. The assessment carries 70% confidence as cross-shareholding disputes and electrification strategy gaps widen.

Renault-Nissan-Mitsubishi Alliance Faces Medium-Probability Breakup Risk from Strategic Misalignment
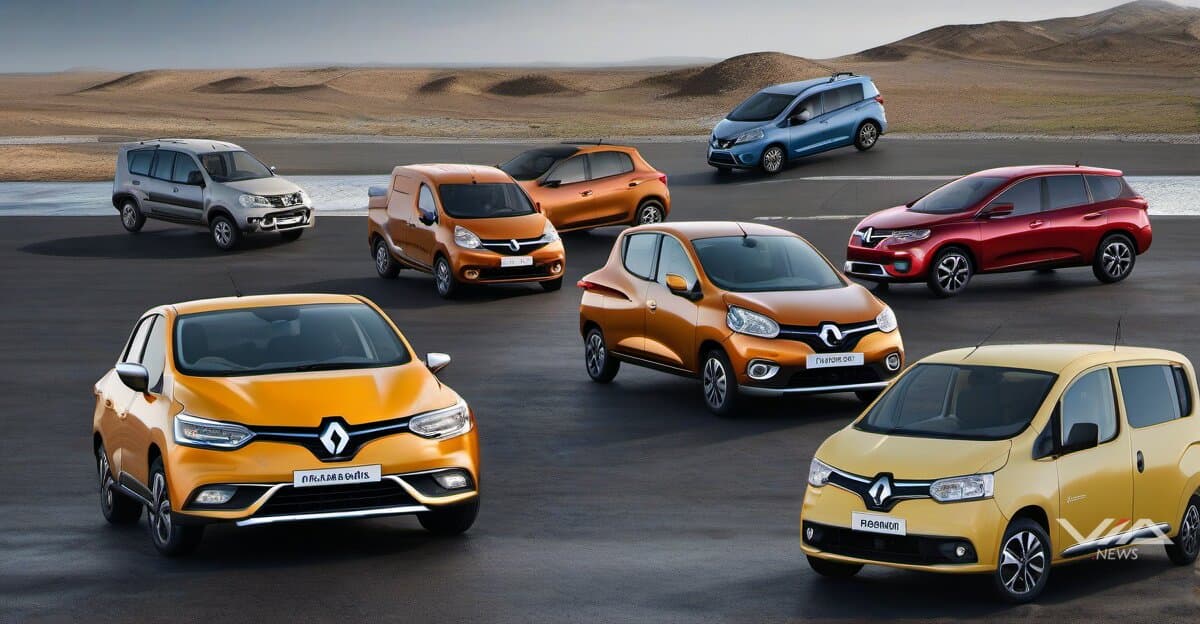
Image generated by AI for illustrative purposes. Not actual footage or photography from the reported events.

The Renault-Nissan-Mitsubishi Alliance faces catastrophic operational risk from strategic misalignment between partner companies, according to recent risk assessments. Analysts rate fragmentation likelihood as medium with 70% confidence.

The alliance controls $180 billion in combined market value across three automakers. Renault holds a 43.4% stake in Nissan, while Nissan owns 15% of Renault without voting rights. Mitsubishi joined in 2017 with Nissan holding a 34% stake.

Strategic divergence centers on electrification timelines and regional market priorities. Nissan accelerates EV investment in North America and China. Renault focuses hybrid technology for European markets. Mitsubishi pursues plug-in hybrids for Southeast Asian operations.

Cross-shareholding disputes emerged in 2023 when Nissan resisted Renault's push to reduce its stake to 15%. The French government's 15% Renault ownership complicates governance. Japanese executives view the structure as colonial-era imbalance.

Investors face portfolio risks from potential alliance dissolution. Shared platform costs drop 30% through joint development. Separation would force duplicate R&D spending estimated at $5-8 billion annually per company. Supply chain integration spans 400 component suppliers.

The alliance produces 7.8 million vehicles annually across 122 plants. Platform sharing generates $5.7 billion in annual cost savings. Technology pooling covers autonomous driving systems, battery development, and connected vehicle platforms.

Credit rating agencies monitor alliance stability for debt covenants. Moody's assigned negative outlook to Nissan's Baa3 rating citing governance uncertainty. Renault trades at 0.3x book value versus 0.5x for independent European automakers.

Alternative scenarios include full merger, equity rebalancing, or structured separation. Each path carries distinct valuation impacts. Merger creates regulatory hurdles in France and Japan. Rebalancing requires $10 billion cash settlement. Separation triggers asset division disputes.

Portfolio managers reduce exposure to alliance stocks pending resolution. Institutional ownership dropped 12% in Nissan shares over six months. Renault shares trade 18% below sector averages on governance concerns.

What we know · the intelligence behind this page
Live from the substrate
What we're seeing
Q4 2026 Biopharma Catalyst Cluster: Late-Stage Readouts and Regulatory Milestones
October 2026 brings a dense run of Phase 3 wins (ALOFT-IPF, RESTORE-3), new data presentations (Roche, Bayer, Lilly, Vertex, Galderma) and regulatory steps (FDA acceptance of Roche's vamikibart BLA, Scholar Rock's EMA resubmission). The next big catalyst is the ivonescimab FDA PDUFA date on 2026-11-14. Obesity combination studies (REDEFINE 4, TOGETHER-PsO) and the 2027 Maritime-1 completion point to more catalysts ahead. QAIAx's speculative AI-linked trial claims (the QIII pilot, targeted for 2027) are an unrelated micro-cap sideshow with weak evidence, and have little in common with the large-cap pipeline news.
Our read on the data ›
Signals we're tracking
EPKINLY Regulatory-Clinical Success Cascade
High probability of expanded label indications, additional combination approvals, and competitive positioning strength in follicular lymphoma market. Predicts positive commercial uptake and potential accelerated review for related indications.
Patterns we're watching ›
Where sources disagree
ING Group
Both facts record the same metric (shares_outstanding) for ING Group at the identical observation date (2025-12-31). FACT A states 2,902,437,688 shares; FACT B states 2,902 million shares (2,902,000,000). The difference is 437,688 shares (~0.015%). This is a genuine value conflict, though the discrepancy appears to result from FACT B rounding to the nearest million while FACT A provides the precise count.
We flag conflicts openly ›
Recently verified
✓ Checked against the original source
4,986
facts traced to their source — and we flag the ones that don't hold up.
101 entities tracked4,986 facts checked against source5,377 source documents archived
Query this data → isubstrate.com