
Thursday, October 15, 2026

MP Materials targets $700M+ magnet capacity expansion to 10,000 tonnes by 2028

MP Materials plans to commission its 10X magnet manufacturing facility in 2028, scaling annual production capacity from 1,000 to 10,000 metric tonnes. The expansion represents a tenfold increase in domestic rare earth magnet output as U.S. manufacturers seek alternatives to China-dominated supply chains.

Source Trace Score1 source document1 with a live linkVerifiability: Basic
MP Materials targets $700M+ magnet capacity expansion to 10,000 tonnes by 2028
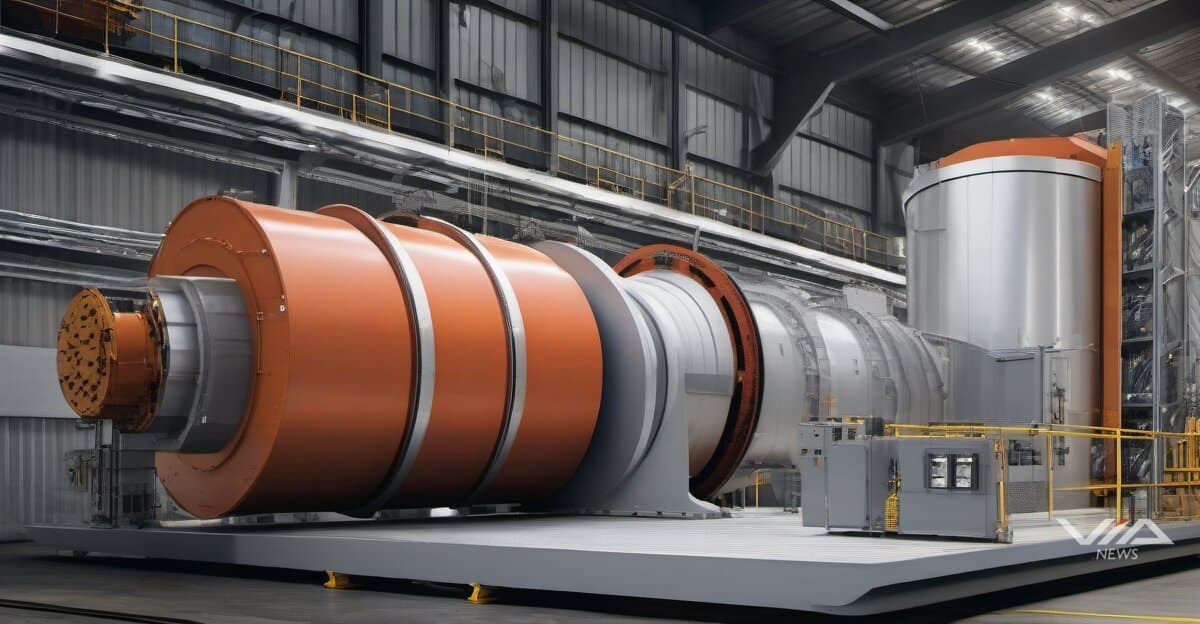
Image generated by AI for illustrative purposes. Not actual footage or photography from the reported events.

MP Materials is targeting 2028 commissioning for its 10X magnet manufacturing facility, a project designed to increase annual production capacity from 1,000 to 10,000 metric tonnes. The tenfold expansion positions the company to capture growing demand from electric vehicle and renewable energy sectors.

The facility investment addresses critical supply chain vulnerabilities. China controls roughly 90% of global rare earth magnet production, creating concentration risk for U.S. defense contractors and automotive manufacturers. MP Materials operates North America's only integrated rare earth mining and processing site at Mountain Pass, California.

Rare earth magnets generate $2.8 billion in annual U.S. imports, primarily from Chinese suppliers. The 10,000-tonne target would cover approximately 15% of current domestic consumption, assuming stable demand growth through 2028. EV motors require 1-2 kilograms of neodymium-iron-boron magnets per vehicle, translating to potential supply for 5-10 million units annually.

Capital expenditure for the 10X facility has not been publicly disclosed. Comparable magnet manufacturing plants in China cost $200-300 million for 5,000-tonne capacity, suggesting MP Materials' investment likely exceeds $400 million. The company reported $535 million in cash and equivalents as of Q3 2024, indicating probable debt or equity financing needs.

Commissioning timelines carry execution risk. Magnet manufacturing requires precise temperature control and coating processes that typically take 18-24 months to optimize. Any delays push revenue generation into 2029 or beyond, extending payback periods for investors.

The expansion supports U.S. Department of Defense initiatives to secure domestic magnet supplies for guided missiles, jet fighters, and submarines. Pentagon contracts often include premium pricing for guaranteed domestic sourcing, potentially improving margins versus commercial sales.

MP Materials shares trade at 3.2x forward sales, above the 2.1x average for specialty materials manufacturers. Investors are pricing in successful execution of the capacity expansion and sustained rare earth prices above $65 per kilogram.

Source documents

Via News is a conduit. We point to the source documents behind this report — we don't replace them. Trace any claim to its source and decide what to trust. How we source

Source Trace Score1 source document1 with a live linkVerifiability: Basic
  1. [1]News articleYahoo Finance· January 13, 2026
    Will the US’ onshoring strategy remove China’s chokehold on REEs?
What we know · the intelligence behind this page
Live from the substrate
What we're seeing
Q4 2026 Clinical Catalyst Season: Big-Pharma Data Flow, Regulatory Milestones, and a Thin AI-Drug Fringe
October 2026 conferences (EASD, IGCS, NACFC, HFSA) are producing a dense run of late-stage readouts from Novo Nordisk, Lilly, Roche, Bayer, Vertex and Galderma. Regulatory milestones are scheduled behind them: the ivonescimab BLA PDUFA date on 2026-11-14, FDA acceptance of Roche's vamikibart BLA, and Scholar Rock's EMA resubmission. The AI-and-finance angle is peripheral. It consists of the AI-designed drug Rentosertib and QAIAx, a speculative microcap whose trial claims (the QIII pilot, anticipated 2027-01-01, and a patent update) are forecasts and filings rather than data, so they warrant skepticism.
Our read on the data ›
Signals we're tracking
EPKINLY Regulatory-Clinical Success Cascade
High probability of expanded label indications, additional combination approvals, and competitive positioning strength in follicular lymphoma market. Predicts positive commercial uptake and potential accelerated review for related indications.
Patterns we're watching ›
Where sources disagree
ING Group
Both facts record the same metric (shares_outstanding) for ING Group at the identical observation date (2025-12-31). FACT A states 2,902,437,688 shares; FACT B states 2,902 million shares (2,902,000,000). The difference is 437,688 shares (~0.015%). This is a genuine value conflict, though the discrepancy appears to result from FACT B rounding to the nearest million while FACT A provides the precise count.
We flag conflicts openly ›
Recently verified
✓ Checked against the original source
4,986
facts traced to their source — and we flag the ones that don't hold up.
101 entities tracked4,986 facts checked against source5,375 source documents archived
Query this data → isubstrate.com